Dr Alexandra Williamson, Associate Professor Wendy Scaife, 4 December, 2021
Do you perceive Chief Executive Officers (CEOs) and Managing Directors (MDs) as stingy or generous?
Who keeps the record, and what do we know?
For the past 20 years, QUT’s Australian Centre for Philanthropy and Non-profit Studies (ACPNS) has analysed Australian Taxation Office (ATO) data. This exercise shows the patterns of donations to Deductible Gift Recipient organisations (DGRs), that Australian individual taxpayers make and claim as deductions in their income tax returns. Emeritus Professor Myles McGregor-Lowndes, Marie Balczun and Dr Alexandra Williamson recently analysed the data from the 2017-18 financial year, released by the ATO in August 2020. The consistent and careful analysis by ACPNS over the decades provides unique trend information on the age, gender, state of location and occupation of Australian donors.
Profile of CEOs and manager directors
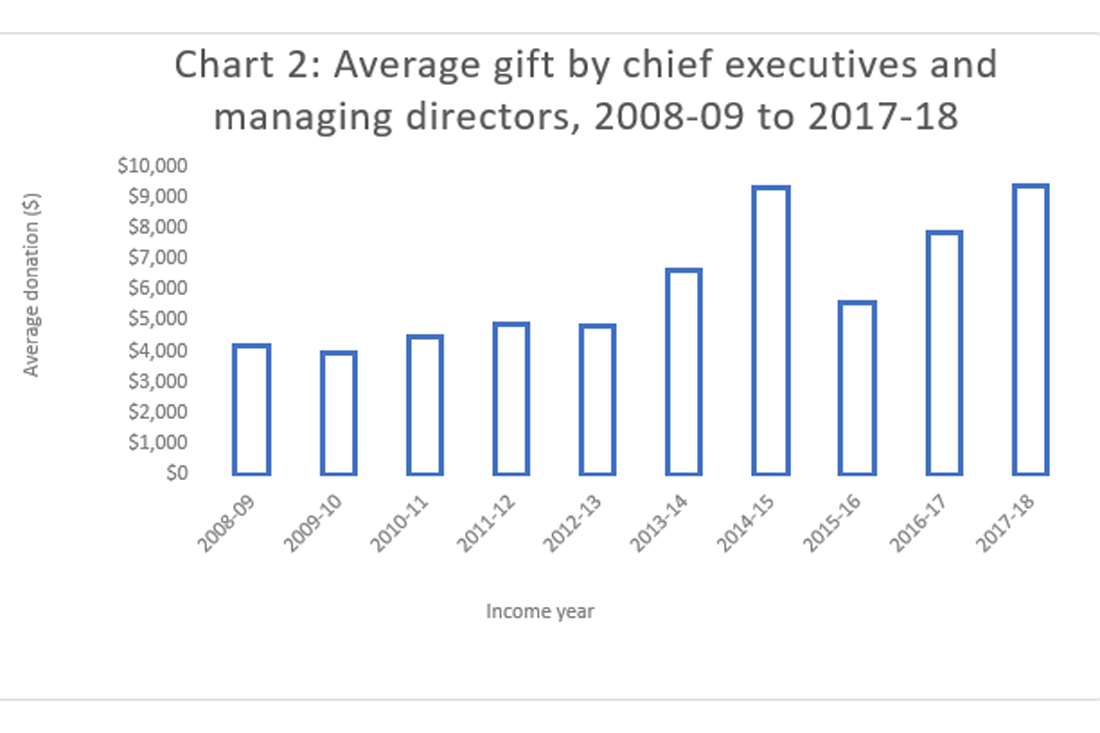
Consistent with previous years, in 2017–18, the highest average gift deductions were claimed by CEOs and MDs ($9,358.98). This is up 18.9% per cent from the year before, where the average gift claimed was $7,781.56.
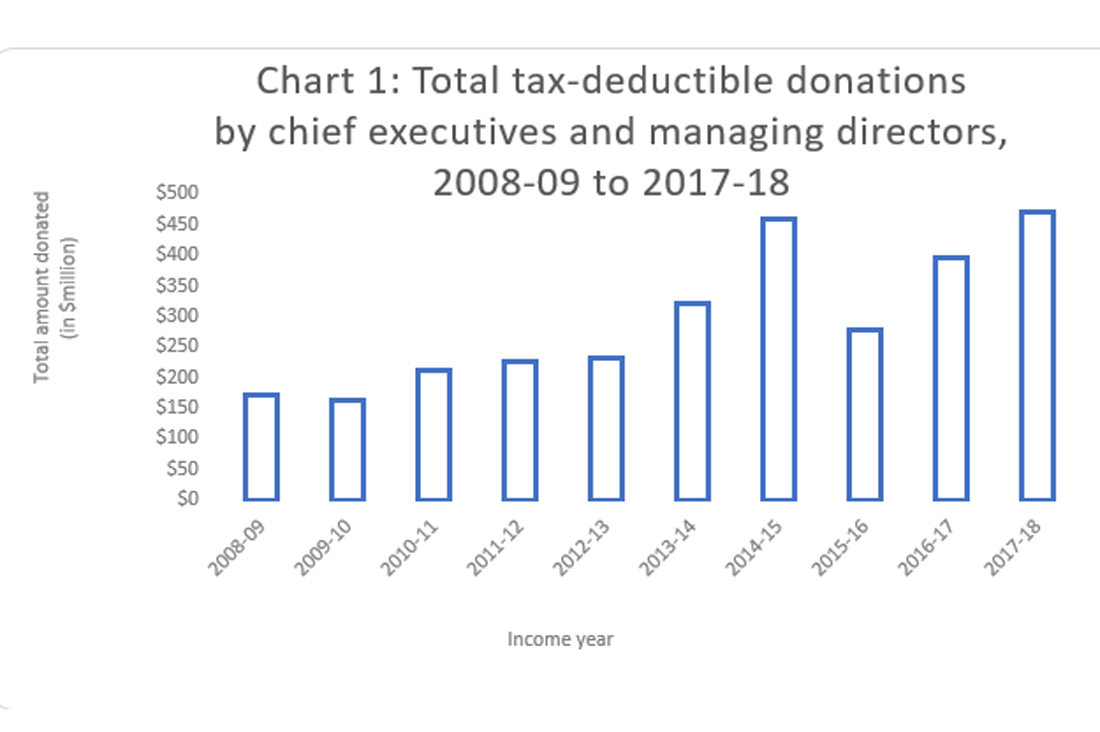
CEOs and MDs were also the occupation group with the highest total amount claimed as gift deductions ($470,354,085). This is consistent with previous years and up 18.96 per cent from 2016–17, where the total amount donated from this occupation code was $395,380,600. This occupation has consistently donated the highest amount in total since data was first collected in the 2006–07 year.
CEOs and MDs had the third-highest deductible gift as a percentage of taxable income (1.50 per cent), following just behind religious leaders (1.90 per cent), then barristers (1.52 per cent).
What does data suggest?
Chart 1 shows the total amount donated by CEOs and MDs since 2008–09, indicating this amount has steadily increased each year except 2015–16.

Chart 2 displays the average donation by CEOs and MDs from 2008–09 to 2017–18. It follows the same pattern as the total gifts with a sharp increase in 2014–15, followed by a decrease in 2015–16 and a rise again in 2016–17 and 2017–18.

There has been little change in the donations by occupation over the years with CEOs & MDs claiming the highest amount both in total and in the average gift. This occupation has consistently been in the top two for both total amount donated and average donation since 2008–09.

